
Market Report · July 15, 2026

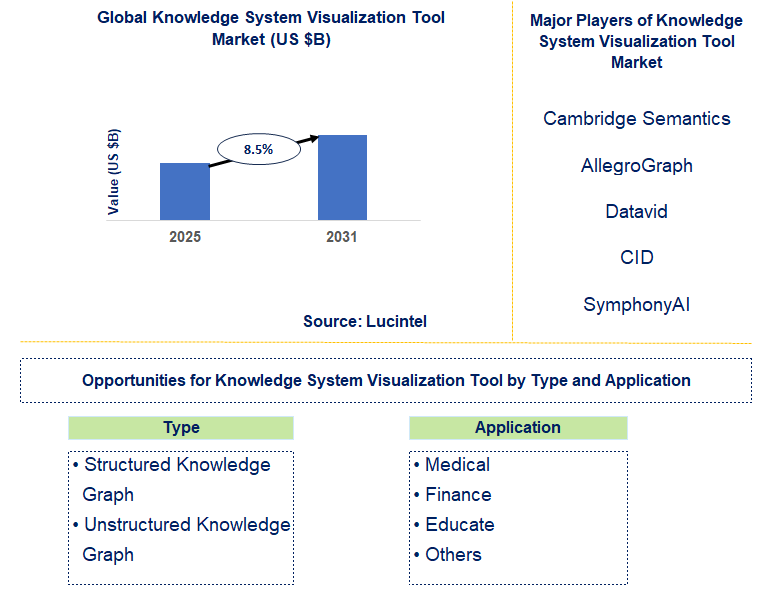
Key data points: The growth forecast = 8.5% annually for the next 7 years. Scroll below to get more insights. This market report covers Trends, opportunities and forecasts in knowledge system visualization tool market to 2031 by type (structured knowledge graph and unstructured knowledge graph), application (medical, finance, educate, and others), and region (North America, Europe, Asia Pacific, and the Rest of the World)
We'll send your sample report shortly.
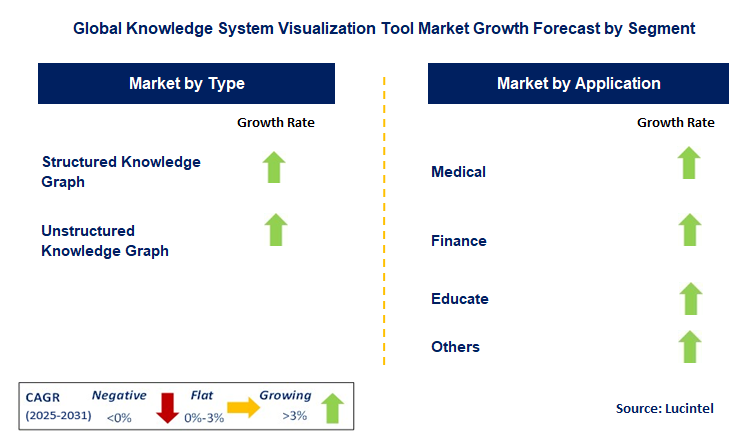
• Lucintel forecasts that, within the type category, structured knowledge graph is expected to witness higher growth over the forecast period.
• Within the application category, medical is expected to witness the highest growth.
• In terms of region, APAC is expected to witness the highest growth over the forecast period.
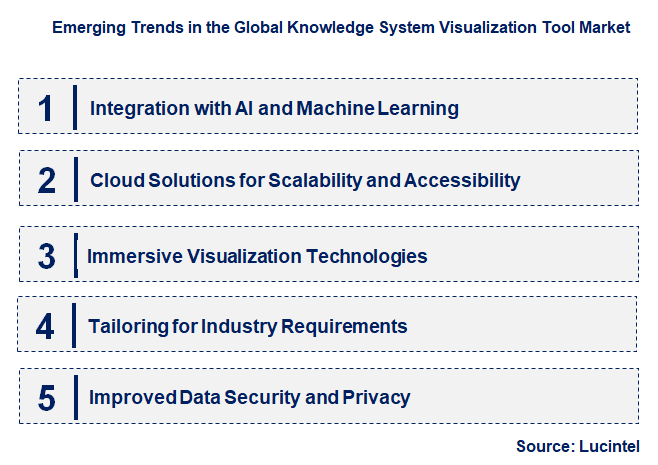
• Integration with AI and Machine Learning: Integration with AI and machine learning into tools for knowledge system visualization is changing the way data is analyzed and visualized. These technologies make it possible for tools to present predictive analytics as well as give smarter, more dynamic visualizations. Tools empowered by AI are able to recognize trends, correlation, and outliers automatically, facilitating users in decision-making without possessing extensive expertise in data analysis.
• Cloud Solutions for Scalability and Accessibility: Cloud computing has emerged as a prime facilitator of the Knowledge System Visualization Tool market. Cloud platforms provide the storage and analysis of huge amounts of data, making it possible for real-time collaboration and scalability between organizations. Users can access the tools remotely, which makes them more flexible and cost-saving, especially for organizations with minimal IT infrastructure.
• Immersive Visualization Technologies: The application of augmented reality (AR) and virtual reality (VR) is a forthcoming trend in knowledge system visualization business. AR and VR technologies ensure immersive experiences whereby users can get in touch with and investigate data sets in the three-dimensional domains. AR and VR technologies contribute to healthcare, architecture, as well as instruction by offering an easier and immersive method of system and data visualizations.
• Tailoring for Industry Requirements: With industries embracing Knowledge System Visualization Tools, there is an emerging need for solutions that are specifically tailored to the requirements of the industry. The visualization tools are being tailored to suit the precise needs of sectors like healthcare, finance, education, and manufacturing. The tailored tools provide advanced features addressing the industry-specific problems, such as regulatory requirements, real-time data processing, and system optimization.
• Improved Data Security and Privacy: With the growing use of knowledge system visualization tools, data security and privacy have emerged as top issues. Firms are spending money on sophisticated security features to safeguard sensitive information against cyber-attacks. Encryptions, user identification, and safe cloud storage are some of the features being added to visualization tools to guarantee that data is stored safely and in conformance with international data privacy laws. These trends are transforming the knowledge system visualization tool market by making tools smarter, scalable, immersive, and secure. The convergence of AI, machine learning, and AR/VR technologies is expanding the capabilities of these tools, while customization and increased security are making them suitable for the unique requirements of industries worldwide.
• Evolution of Real-Time Data Processing Features: Among the major advancements in the marketplace is the inclusion of real-time data processing features in knowledge system visualization tools. This enables enterprises to track and analyze data while it is being created, and present updated insights that enable companies to make faster and more accurate decisions. Such a feature proves highly valuable across sectors such as finance, healthcare, and manufacturing, where operational efficiency is significantly dependent on real-time data.
• Enhanced User Interfaces and Accessibility: Firms are emphasizing making the user experience (UX) and accessibility of knowledge system visualization tools better. This involves creating more intuitive interfaces through which non-technical staff can easily work with complicated data. Easier interfaces enable staff within an organization to utilize the tools, thereby promoting wider utilization and collaboration within decision-making activities.
• Integration with Internet of Things (IoT) Systems: The integration of knowledge system visualization software with IoT systems has emerged as a major innovation. IoT gadgets produce enormous quantities of data, and visualization tools are now applied to depict such data in real time. Through this integration, companies can better monitor and manage operations by achieving a clear snapshot of performance factors and system integrity.
• Emphasis on Mobile Accessibility: Owing to increasing demand for mobile-friendly solutions, knowledge system visualization tools are now being optimized to be used on smartphones and tablets. Mobile accessibility enables employees to view data visualizations and insights remotely, and hence, they can make well-informed decisions from anywhere. This innovation is especially crucial in industries with fieldwork, i.e., logistics and transportation.
• Adoption of Decision Support Using AI-Powered Analytics: AI-powered analytics are being incorporated into knowledge system visualization platforms to improve decision support. These platforms employ machine learning algorithms to detect data patterns, providing recommendations or predictions to help in decision-making. This is particularly significant in industries such as healthcare, where decision support in real-time can directly influence outcomes. These advancements are evidence of the increasing level of knowledge system visualization tool sophistication and access. With real-time data processing, enhanced interfaces, IoT connectivity, and AI-driven analytics, the tools are becoming more capable and user-friendly, allowing organizations to make more informed decisions across sectors.
• Healthcare and Life Sciences: In the healthcare industry, knowledge system visualization tools are utilized to enhance patient results, care for healthcare information, and facilitate clinical choice. As electronic wellbeing documents (EHRs) and vast data are being progressively implemented, a noteworthy prospect for these tools to increase medicinal research, determination, and customized treatment designs exists.
• Financial Services and Risk Management: Financial services organizations are increasingly embracing knowledge system visualization tools to enhance risk management, fraud detection, and financial forecasting. These tools enable visualization of financial data, facilitating decision-makers to evaluate trends and risks. As the financial sector continues to adopt digital transformation, the use of these tools is likely to increase.
• Manufacturing and Supply Chain Optimization: Visualization tools are being applied in manufacturing to optimize production operations and enhance supply chain management. Visualization tools can be used to visualize inventory levels, production schedules, and equipment performance, resulting in improved decision-making and greater efficiency. With Industry 4.0 technologies ongoing, there is significant room for expansion in this space.
• Education and Training: Knowledge system visualization tools are applied in education to facilitate interactive learning, handle educational content, and represent complicated concepts. It is most useful in engineering, medicine, and architecture. The growing use of e-learning and online learning platforms offers a lucrative growth potential for knowledge visualization tools.
• Retail and Customer Experience: Retailers are utilizing knowledge system visualization tools to learn about consumer behavior, monitor inventory, and refine sales plans. The tools enable retailers to visualize customer preferences, trends, and buying patterns, allowing them to design more effective marketing campaigns and enhance customer satisfaction. With the growth of e-commerce, this use is anticipated to continue expanding. These strategic growth opportunities capture the wide variety of uses for knowledge system visualization tools in industries. With increasing demand for data-driven insights, businesses in healthcare, finance, manufacturing, education, and retail sectors stand to gain immensely by embracing these cutting-edge tools.
• Cambridge Semantics
• AllegroGraph
• Datavid
• CID
• SymphonyAI
• Neo4j
• Metaphacts
• Ontotext
• Cognite
• landray
• Structured Knowledge Graph
• Unstructured Knowledge Graph
• Medical
• Finance
• Educate
• Others
• North America
• Europe
• Asia Pacific
• The Rest of the World
• United States: The United States continues to be a major market for knowledge system visualization tools, fueled by the high velocity of growth of technology firms and utilization of artificial intelligence and machine learning technologies. Key developments in this market involve the incorporation of virtual reality (VR) and augmented reality (AR) technologies into visualization platforms, providing users with an immersive experience for comprehending sophisticated systems. In addition, American businesses are placing greater emphasis on creating more intuitive, user-friendly interfaces to meet the needs of non-technical users and encourage collaboration across organizations. Cloud-based solution innovations are also making it easier to scale and view data in real time, making them more accessible to businesses of any size.
• China: China is gaining considerable ground in the knowledge system visualization tool market, driven in large part by the nation's growing focus on smart technologies and analytics driven by artificial intelligence. The government drive for digital innovation has resulted in the use of sophisticated visualization tools in a wide range of industries such as healthcare, education, and manufacturing. Chinese businesses are also creating in-house tools that are capable of processing large volumes of data from IoT devices with visual representations to enable companies to make improved decisions. Increased utilization of big data analytics is serving to drive these tools into the mainstream, while cloud computing platforms are fueling broad adoption of visualization technologies.
• Germany: Germany, with its robust industrial sector, has been adopting knowledge system visualization tools in order to boost operations, improve decision-making, and streamline intricate production systems. Advances in Germany are the incorporation of such tools into the auto, engineering, and manufacturing industries for data-driven decision-making and enhanced efficiency. German companies are also concentrating on building security functionality to secure important data visualized by such systems, following rising cybersecurity threats. The nation's focus on Industry 4.0 and smart manufacturing is another major driver, which has created the need for more sophisticated and specialized visualization tools.
• India: India is witnessing increasing adoption of knowledge system visualization tools across industries like IT, education, and healthcare. The Indian market is witnessing growth driven by increased demand for improved data analysis and management tools as companies continue to digitize. Recent advances involve using AI and machine learning to give more precise and dynamic visualizations of big datasets. Moreover, firms are also making efforts to make these tools cheaper and easily accessible, responding to the different needs of SMEs across the nation. Government efforts to improve digital literacy are also helping such tools gain momentum.
• Japan: Japan has always been at the forefront of embracing the latest technology, and knowledge system visualization tools are no different. Japan has recently witnessed greater demand for sophisticated data visualization tools, especially in industries like robotics, healthcare, and electronics. Japanese corporations are heavily investing in AI and machine learning in order to make these tools more capable, more responsive to real-time data, and better equipped with predictive analytics. The growth of smart factories and automation technologies is also fueling demand for more advanced knowledge visualization systems, which enable companies to derive greater insights from operational data and make quicker, better-informed decisions.
• Cambridge Semantics
• AllegroGraph
• Datavid
• CID
• SymphonyAI
• Neo4j
• Metaphacts
• Ontotext
• Cognite
• landray Q5. Which knowledge system visualization tool market segment will be the largest in future? Answer: Lucintel forecasts that, within the type category, structured knowledge graph is expected to witness higher growth over the forecast period. Q6. In knowledge system visualization tool market, which region is expected to be the largest in next 5 years? Answer: In terms of region, APAC is expected to witness the highest growth over the forecast period. Q7. Do we receive customization in this report? Answer: Yes, Lucintel provides 10% customization without any additional cost.


Choose a license that fits your team. Instant PDF delivery.
Prices exclude taxes. Instant delivery. Custom licensing available on request.
Market Report · July 15, 2026
Market Report · June 26, 2026
Market Report · June 24, 2026
Trusted partner for strategic intelligence and business growth


Receive a complimentary market analysis tailored to your industry. Our analysts will identify key growth opportunities and competitive dynamics specific to your business.

Market size, growth rate, and key trend analysis for your specific sector.

Top competitor positioning and market share analysis.

Strategic recommendations backed by data-driven insights.
Get curated market intelligence and competitive moves straight to your inbox.
By subscribing, you agree to receive our monthly insights. Unsubscribe anytime.
Receive a complimentary market analysis tailored to your industry. Our analysts will identify key growth opportunities and competitive dynamics specific to your business.
Market size, growth rate, and key trend analysis for your specific sector.
Top competitor positioning and market share analysis.
Strategic recommendations backed by data-driven insights.
Get curated market intelligence, emerging trends, and competitive moves straight to your inbox each month.
By subscribing, you agree to receive our monthly insights. Unsubscribe anytime.
We'll send your sample report shortly.