
Energy Cable Market
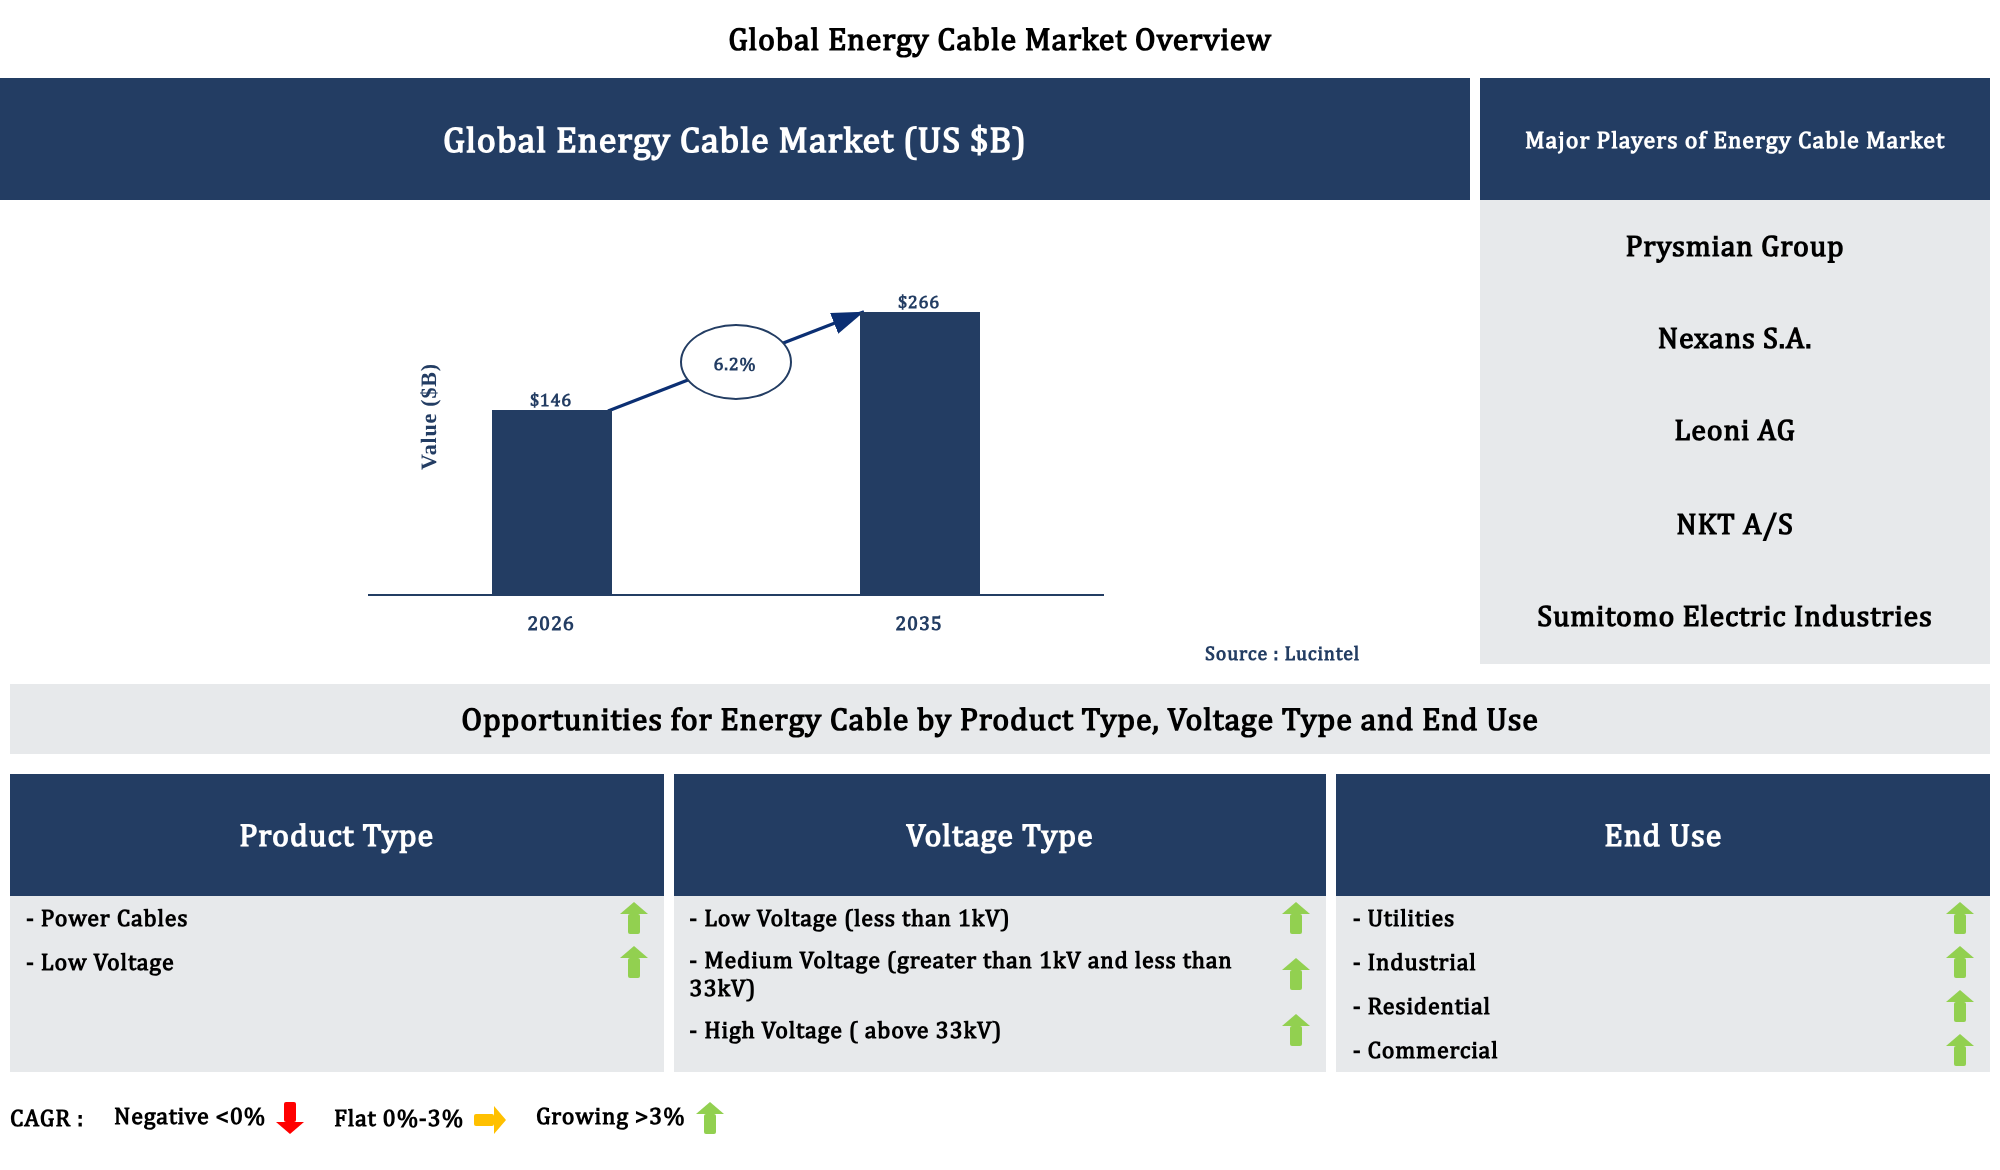
The future of the global energy cable market looks promising with opportunities in the utility, industrial, residential, and commercial markets. The global energy cable market is expected to reach an estimated $266 billion by 2035 with a CAGR of 6.2% from 2026 to 2035. The major drivers for this market are the rising demand for electric vehicle charging networks, the growing demand for transmission & distribution infrastructure, and the increasing demand for industrial electricity consumption.
Gain valuable insights for your business decisions with our comprehensive 150+ page report. Sample figures with some insights are shown below.
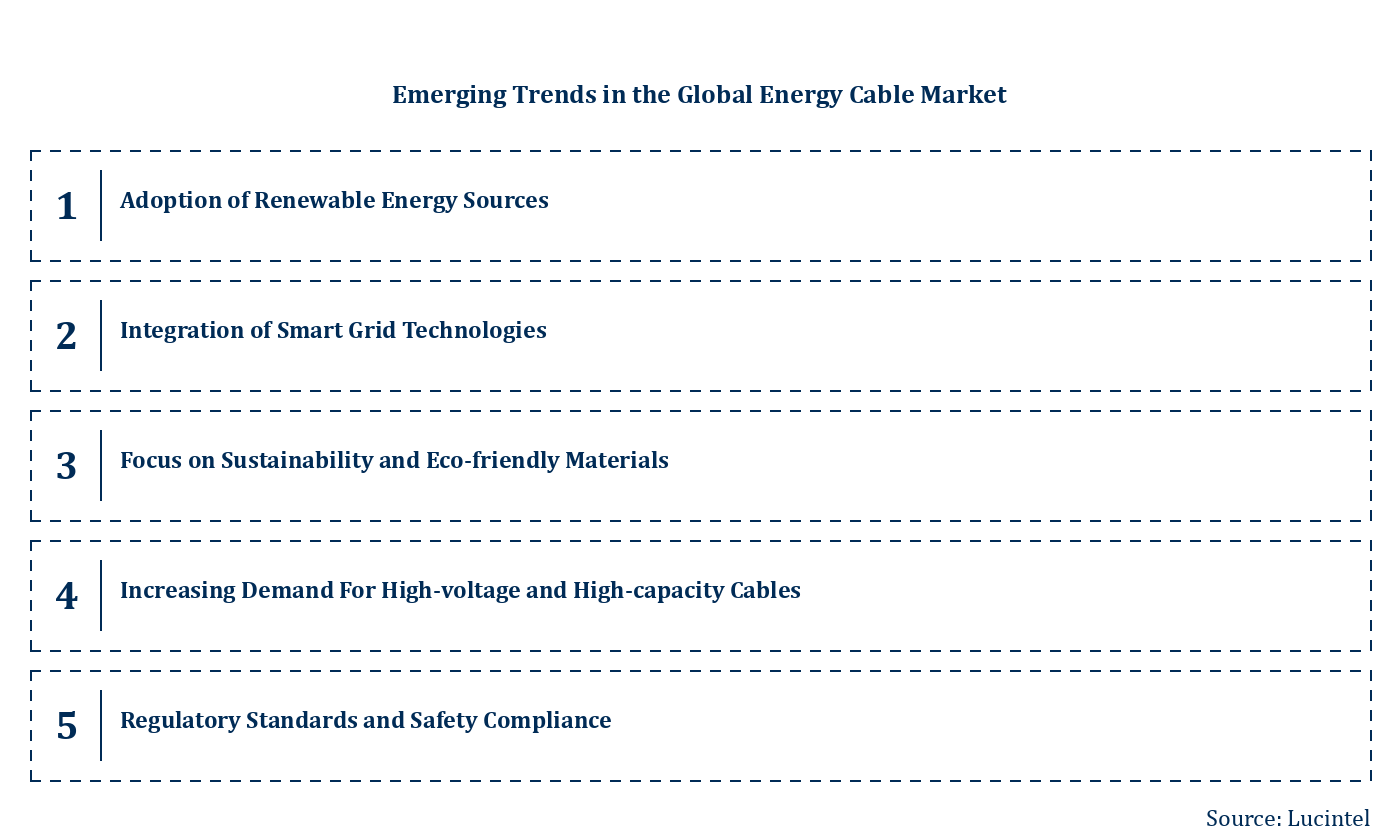
Emerging Trends in the Energy Cable Market
The energy cable market is experiencing rapid transformation driven by technological advancements, increasing demand for renewable energy, and evolving regulatory standards. As global energy needs grow and sustainability becomes a priority, manufacturers are innovating to meet new challenges. The market is also influenced by digitalization, smart grid integration, and the push for more efficient, durable, and environmentally friendly cables. These developments are reshaping the competitive landscape, creating new opportunities, and demanding higher standards of quality and innovation. Understanding these emerging trends is crucial for stakeholders aiming to stay ahead in this dynamic industry.
These emerging trends are collectively reshaping the energy cable market by fostering innovation, promoting sustainability, and enhancing efficiency. They are enabling the industry to meet the growing global demand for reliable, eco-friendly, and technologically advanced energy transmission solutions, ultimately driving market growth and competitiveness.
Recent Developments in the Energy Cable Market
The energy cable market is experiencing rapid evolution driven by technological advancements, increasing demand for renewable energy, and infrastructure modernization. These developments are shaping the future landscape, creating new opportunities for manufacturers and stakeholders. As global energy needs grow, innovation and sustainability are becoming central to market strategies. The following key developments highlight the current trajectory and potential growth areas within this dynamic industry.
The energy cable market is being reshaped by technological innovations, infrastructure upgrades, and sustainability initiatives. These developments are fostering a more efficient, reliable, and environmentally friendly energy transmission network. As a result, market growth is accelerating, driven by increased demand for advanced, durable, and adaptable cabling solutions across diverse applications. This evolving landscape promises significant opportunities for industry players and stakeholders aiming to capitalize on emerging trends.
Strategic Growth Opportunities in the Energy Cable Market
The energy cable market is experiencing rapid expansion driven by increasing global energy demands, infrastructure development, and technological advancements. As countries focus on renewable energy integration and smart grid deployment, the need for reliable, efficient, and high-capacity cables grows. Market players are exploring innovative materials and manufacturing processes to meet evolving standards. Strategic investments and partnerships are crucial for capturing emerging opportunities across diverse applications, ensuring sustainable growth and competitive advantage in this dynamic landscape.
The overall growth opportunities in the energy cable market are poised to significantly influence industry dynamics, fostering innovation, expanding applications, and supporting the global transition toward cleaner, smarter, and more resilient energy systems. These developments will drive market expansion, enhance competitiveness, and promote sustainable energy infrastructure worldwide.
Energy Cable Market Drivers and Challenges
The energy cable market is influenced by a complex interplay of technological advancements, economic conditions, and regulatory frameworks. Rapid innovations in cable manufacturing, such as the development of high-capacity and eco-friendly materials, are driving market growth. Economic factors like increasing infrastructure investments and urbanization further propel demand. Conversely, stringent regulations concerning safety standards and environmental impact pose challenges to market players. Additionally, fluctuating raw material prices and supply chain disruptions impact production and profitability. Understanding these diverse drivers and challenges is essential for stakeholders to navigate the evolving landscape effectively and capitalize on emerging opportunities while mitigating risks.
The factors responsible for driving the energy cable market include:-
The Challenges in The energy cable market Are: -
The energy cable market is driven by technological innovations, infrastructure development, renewable energy expansion, and regulatory standards, which collectively foster growth and innovation. However, challenges such as raw material price volatility, compliance costs, and supply chain disruptions threaten to impede progress. Navigating these drivers and challenges requires strategic planning and adaptability from market participants. Overall, the market's future hinges on technological advancements and regulatory support, balanced against economic and logistical hurdles, shaping a dynamic landscape with substantial growth potential.
List of Energy Cable Market Companies
Companies in the market compete on the basis of product quality offered. Major players in this market focus on expanding their manufacturing facilities, R&D investments, infrastructural development, and leverage integration opportunities across the value chain. Through these strategies energy cable market companies cater increasing demand, ensure competitive effectiveness, develop innovative products & technologies, reduce production costs, and expand their customer base. Some of the energy cable market companies profiled in this report include-
Energy Cable Market by Segment
The study includes a forecast for the global energy cable market by product type, voltage type, end use, and region.
Country Wise Outlook for the Energy Cable Market
The energy cable market has experienced significant shifts driven by technological advancements, increasing demand for renewable energy integration, and evolving regulatory frameworks across the globe. Countries are investing heavily in upgrading infrastructure, adopting sustainable practices, and expanding their renewable energy capacities. These developments are shaping the future landscape of energy transmission and distribution, with a focus on efficiency, safety, and environmental impact. The following summaries highlight recent key developments in the United States, China, Germany, India, and Japan, reflecting their unique strategies and progress in this vital sector.
Features of the Energy Cable Market
Top 5 Companies
Table of Contents
List of Figures
List of Tables
Methodology
Lucintel has been in the business of market research and management consulting since 2000 and has published over 1000 market intelligence reports in various markets / applications and served over 1,000 clients worldwide. This study is a culmination of four months of full-time effort performed by Lucintel's analyst team. The analysts used the following sources for the creation and completion of this valuable report:
- In-depth interviews of the major players in this market
- Detailed secondary research from competitors' financial statements and published data
- Extensive searches of published works, market, and database information pertaining to industry news, company press releases, and customer intentions
- A compilation of the experiences, judgments, and insights of Lucintel's professionals, who have analyzed and tracked this market over the years.
Extensive research and interviews are conducted across the supply chain of this market to estimate market share, market size, trends, drivers, challenges, and forecasts. Below is a brief summary of the primary interviews that were conducted by job function for this report.

Thus, Lucintel compiles vast amounts of data from numerous sources, validates the integrity of that data, and performs a comprehensive analysis. Lucintel then organizes the data, its findings, and insights into a concise report designed to support the strategic decision-making process. The figure below is a graphical representation of Lucintel's research process.

Buy Now
Choose a license that fits your team. Instant PDF delivery.
Prices exclude taxes. Instant delivery. Custom licensing available on request.
Frequently Asked Questions
What is the energy cable market size?
What is the growth forecast for energy cable market?
What are the major drivers influencing the growth of the energy cable market?
What are the major segments for energy cable market?
Who are the key energy cable market companies?
Some of the key energy cable companies are as follows:
- Prysmian Group
- Nexans S.A.
- Leoni AG
- NKT A/S
- Sumitomo Electric Industries
- Encore Wire Corporation
- KEI Industries Limited
Which energy cable market segment will be the largest in future?
In energy cable market, which region is expected to be the largest in next 8 years?
Do we receive customization in this report?
Key Questions
- • What are some of the most promising, high-growth opportunities for the energy cable market by product type (power cables and low voltage), voltage type (low voltage (less than 1kV), medium voltage (greater than 1kV and less than 33kV), and high voltage ( above 33kV)), end use (utilities, industrial, residential, and commercial), and region (North America, Europe, Asia Pacific, and the Rest of the World)?
- • Which segments will grow at a faster pace and why?
- • Which region will grow at a faster pace and why?
- • What are the key factors affecting market dynamics? What are the key challenges and business risks in this market?
- • What are the business risks and competitive threats in this market?
- • What are the emerging trends in this market and the reasons behind them?
- • What are some of the changing demands of customers in the market?
- • What are the new developments in the market? Which companies are leading these developments?
- • Who are the major players in this market? What strategic initiatives are key players pursuing for business growth?
- • What are some of the competing products in this market and how big of a threat do they pose for loss of market share by material or product substitution?
- • What M&A activity has occurred in the last 7 years and what has its impact been on the industry?


